CloudWatch
- Serverless performance monitoring service
Metrics
- Variables to monitor in CloudWatch
- Dimension is an attribute of a metric (instance id, environment, etc.)
- Up to 30 dimensions per metric
- Segregated by namespaces (which AWS service they monitor)
Custom Metrics
- Define and send your own custom metrics to CloudWatch using PutMetricData API
- Metric resolution (StorageResolution API) - frequency of sending metric data
- Standard: 60 seconds
- High Resolution: 1/5/10/30 seconds (higher cost)
- Accepts metric data points two weeks in the past and two hours in the future
EC2 Monitoring
- Must run a CloudWatch agent on instance to push system metrics and logs to CloudWatch. Instance role (IAM) must allow the instance to push logs to CloudWatch.
- EC2 instances have metrics every 5 minutes
- With detailed monitoring (for a cost), you get metrics every 1 minute
- Use detailed monitoring if you want to react faster to changes (eg. scale faster for your ASG)
- Available metrics in CloudWatch:
- CPU Utilization
- Network Utilization
- Disk Performance
- Disk Reads/Writes
- Custom metrics:
- Memory utilization (memory usage)
- Disk swap utilization
- Disk space utilization
- Page file utilization
- CloudWatch agent can be used for logging on premises servers too
- CW Unified Agent can send logs & additional system-level metrics
- CPU (active, guest, idle, system, user, steal)
- Disk metrics (free, used, total), Disk IO (writes, reads, bytes, iops)
- RAM (free, inactive, used, total, cached)
- Netstat (number of TCP and UDP connections, net packets, bytes)
- Processes (total, dead, bloqued, idle, running, sleep)
- Swap Space (free, used, used %)
Dashboards
- Setup custom dashboards for quick access to key metrics and alarms
- Dashboards are global (allows to monitor services across accounts & regions)
- Dashboards can be shared with people who don’t have an AWS account (public, email address, 3rd party SSO provider through Cognito)
Logs
- Used to store application logs
- Log Groups represent an application sending logs to CW
- Log Streams represent instances within applications or log files or containers
- Logs Expiration: never expire (default), 30 days, etc.
- Logs can be sent to:
- S3 buckets (exports)
- Kinesis Data Streams
- Kinesis Data Firehose
- Lambda functions
- ElasticSearch
- Metric Filters can be used to filter expressions and use the count to trigger CloudWatch alarms. They apply only on the incoming metrics after the metric filter was created. Example filters:
- find a specific IP in the logs
- count occurrences of “ERROR” in the logs
- Cloud Watch Logs Insights can be used to query logs and add queries to CloudWatch Dashboards
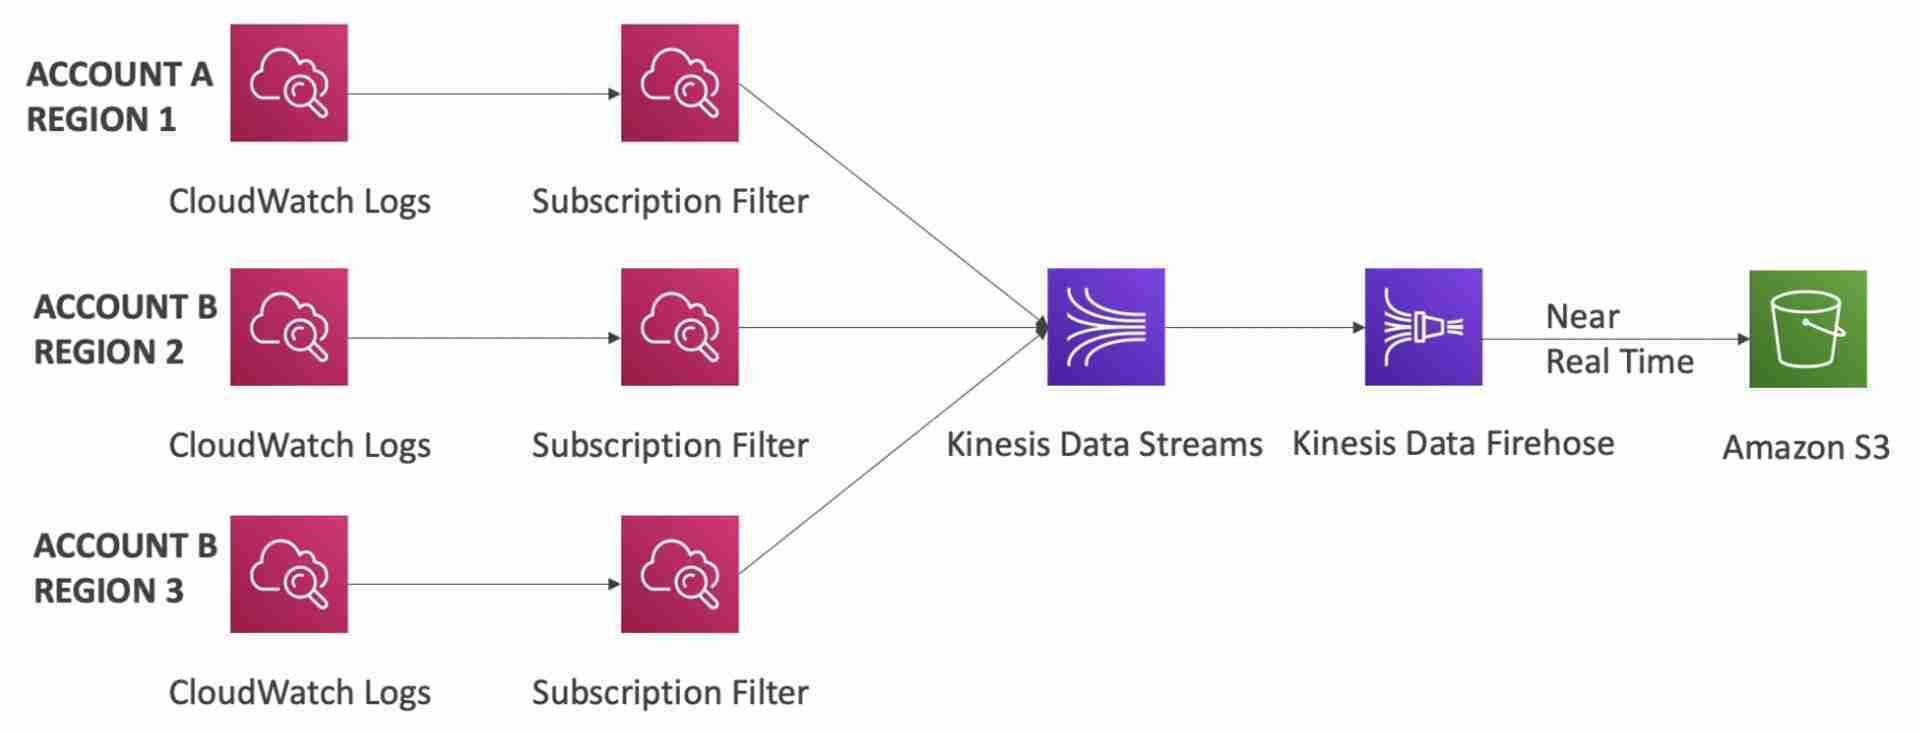
- To stream logs in real-time, apply a Subscription Filter on logs
- Logs can take up to 12 hours to become available for exporting to S3 (not real-time). To store logs in real time in S3, use a subscription filter to publish logs to KDF in real time which will then write the logs to S3.
- Logs from multiple accounts and regions can be aggregated using subscription filters
Metric Filters are a part of CloudWatch Logs (not CloudWatch Metrics)
Alarms
- Alarms are used to trigger notifications for CW metrics based on Metric Filters
- Various options to trigger alarm (sampling, %, max, min, etc.)
- An alarm monitors a single CW metric
- Alarm States:
- OK
- INSUFFICIENT_DATA
- ALARM
- Period:
- Length of time in seconds to evaluate the metric before triggering the alarm
- High resolution custom metrics: 10 sec, 30 sec or multiples of 60 sec
- Targets:
- Stop, Terminate, Reboot, or Recover an EC2 Instance
- Trigger Auto Scaling Action (ASG)
- Send notification to SNS
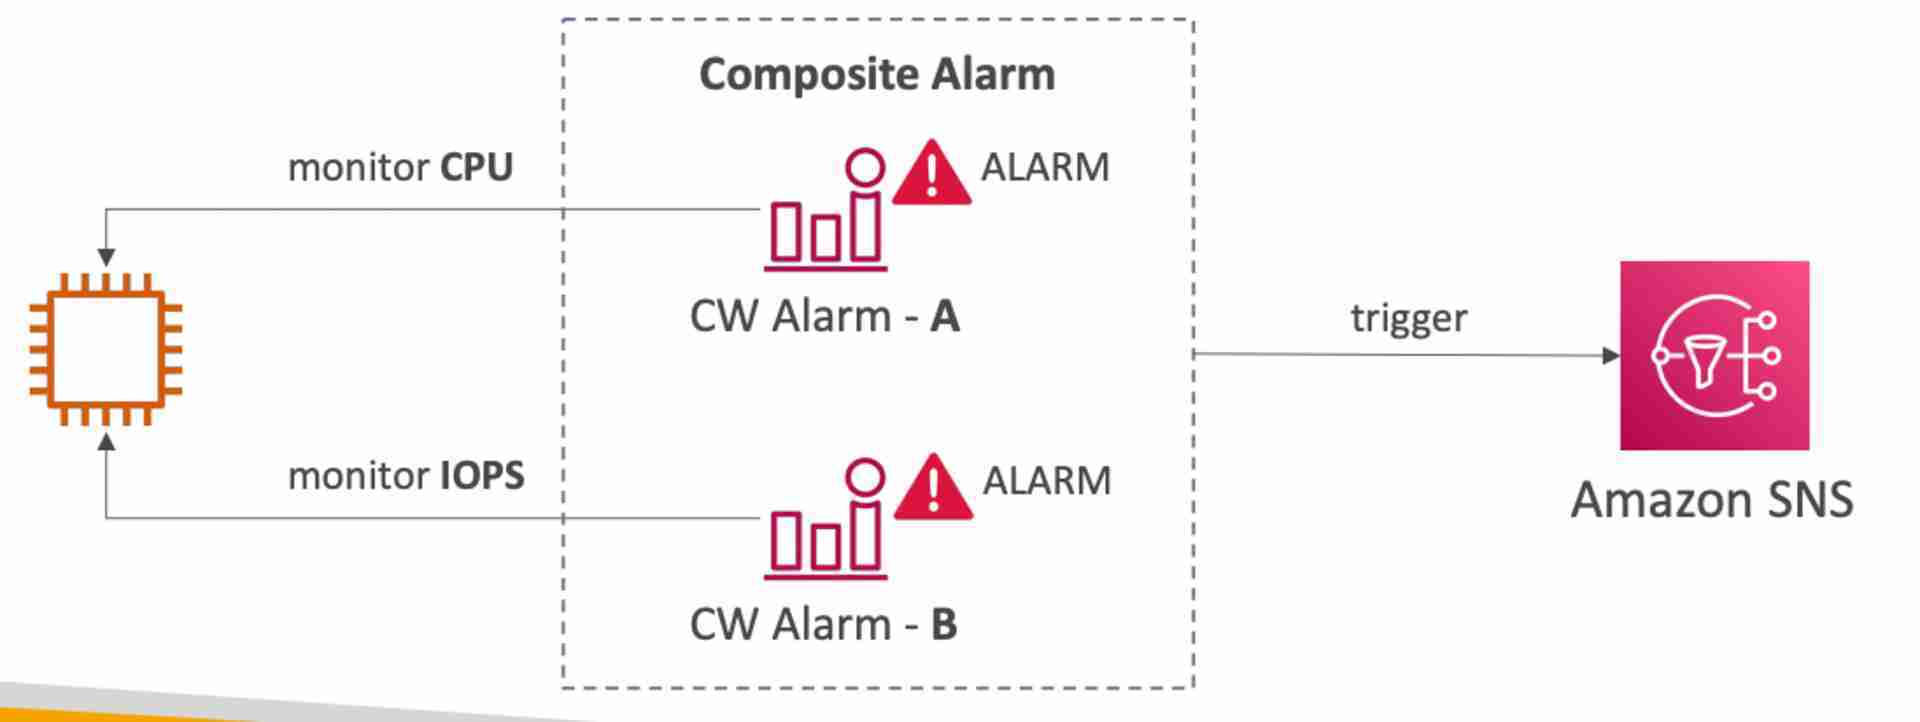
- Composite Alarms monitor multiple other alarms with AND/OR conditions to generate a new alarm.
This is helpful to reduce alarm noise by creating complex composite alarms.
Example: send an SNS notification when both CPU and IOPS are above 90% utilization.

EC2 Instance Recovery
- CloudWatch alarm to automatically recover an EC2 instance if it becomes impaired
- Terminated instances cannot be recovered
- After the recovery, the following are retained
- Placement Group
- Public IP
- Private IP
- Elastic IP
- Instance ID
- Instance metadata
- After the recovery, RAM contents are lost
Events
- Schedule or Cron to create events on a schedule
- Uses default event bus (custom & partner event buses are not supported)
